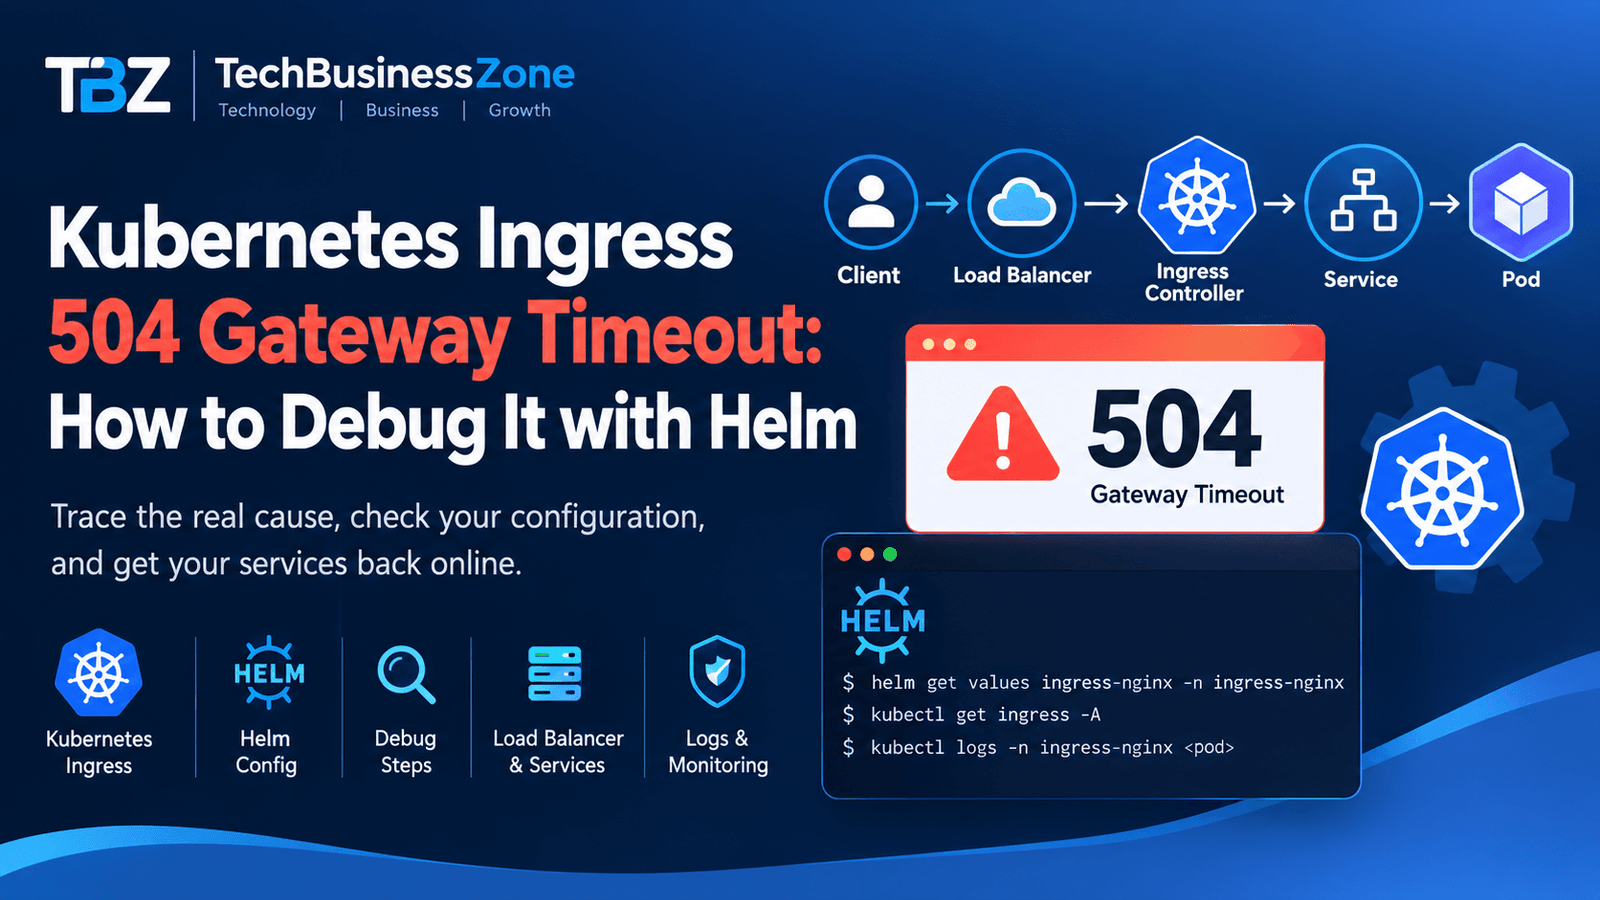
Kubernetes Ingress 504 Gateway Timeout: How to Debug It with Helm
A Kubernetes Ingress returning 504 Gateway Timeout does not necessarily mean your application is down.
That is one of the most common mistakes when debugging this error.
A 504 means that something in the request path waited for an upstream response and eventually gave up. The component returning the 504 could be the Ingress controller, a cloud load balancer, another reverse proxy, or an upstream service.
The difficult part is identifying which layer actually timed out.
This guide shows how to debug kubernetes ingress 504 gateway timeout errors systematically, how to verify the configuration with Helm, how to test the backend without the Ingress, and how to avoid the common mistake of changing timeout values blindly.
Testing note: The commands and configuration checks in this guide are based on Kubernetes and Ingress-NGINX documentation plus real publicly documented incidents. I am not claiming that the commands were executed against a live production Kubernetes cluster from this writing environment. A live cluster test requires access to an actual Kubernetes environment with
kubectl, the relevant Ingress controller, Helm, and its surrounding load-balancer infrastructure.
Requirements Before You Start
Before troubleshooting a 504, collect enough information to identify every layer involved.
You should have:
kubectlaccess to the affected cluster- Helm access if the controller was installed or managed with Helm
- the Kubernetes namespace containing the affected Ingress
- the Ingress name
- the Service name and port
- access to the application Pod logs
- access to the Ingress controller logs
- access to the cloud load-balancer configuration if one exists
- the controller type and version
- the Kubernetes version
- the Helm chart version, if Helm manages the controller
- permission to run an internal request from inside the cluster
For a Helm-managed Ingress-NGINX deployment, these commands establish the basic environment:
kubectl version
helm version

helm list -A

kubectl get ingress -A
kubectl get ingressclass
kubectl get pods -A
Do not start by changing the timeout.
First establish where the request is failing.
What Does a Kubernetes Ingress 504 Gateway Timeout Mean?
A 504 is a gateway or proxy timeout.
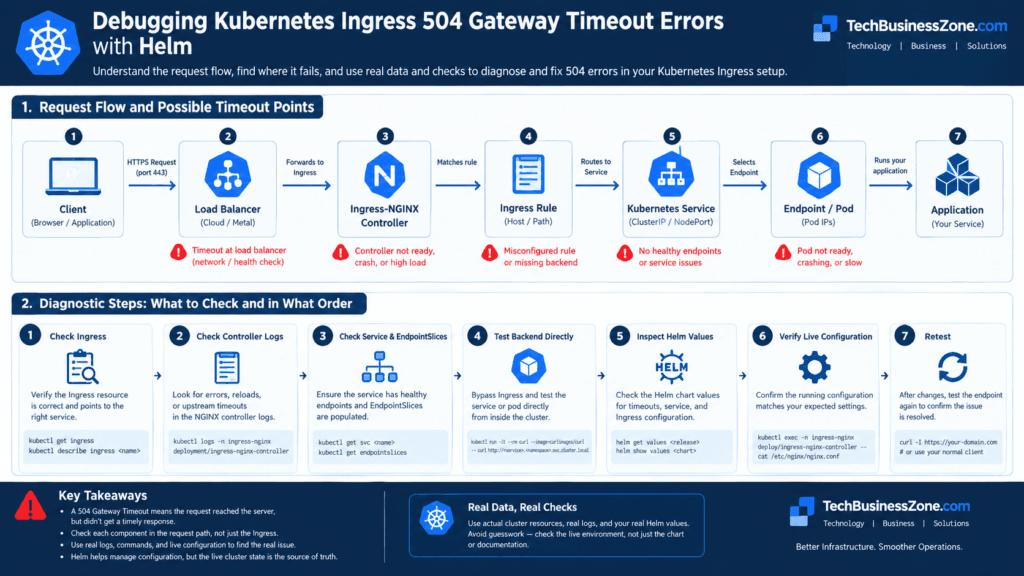
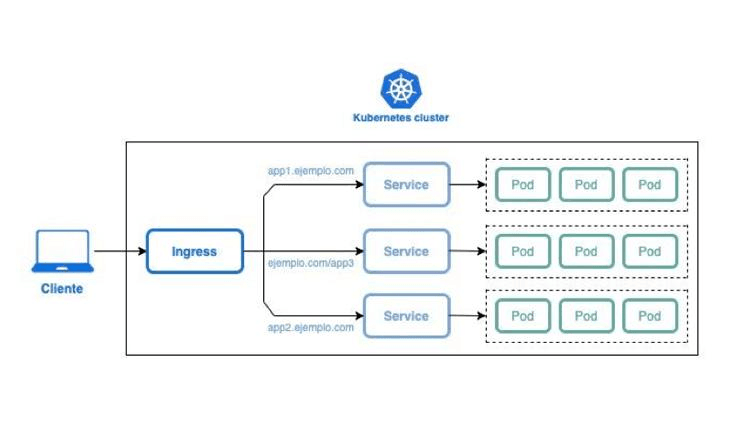
In a typical Kubernetes application, the request can travel through several components:
User
  |
  v
DNS
  |
  v
Cloud Load Balancer
  |
  v
Ingress Controller
  |
  v
Ingress Rule
  |
  v
Kubernetes Service
  |
  v
Endpoint / EndpointSlice
  |
  v
Pod
  |
  v
Application
Kubernetes itself does not define one universal “Ingress timeout.”
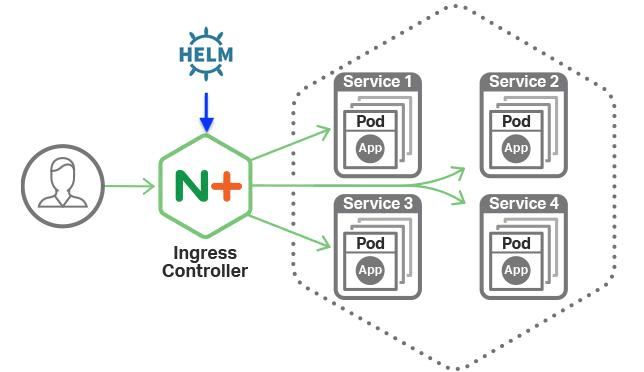
An Ingress is an API object containing HTTP routing rules. An Ingress controller is responsible for implementing those rules, and different controllers can behave differently. Kubernetes explicitly notes that an Ingress requires a controller and recommends reviewing the controller-specific documentation.
Therefore:
A Kubernetes Ingress 504 is a symptom, not a diagnosis.
The timeout may be caused by:
- the external load balancer
- the Ingress controller
- the connection from the controller to the backend
- the Kubernetes Service
- missing or unhealthy endpoints
- NetworkPolicy or networking problems
- slow application processing
- application resource exhaustion
- an upstream API
- TLS problems between proxy and backend
- controller configuration
- controller version-specific behavior
- client-side connection behavior
Why Simply Increasing the Ingress Timeout Often Does Not Work
This is the most important concept in the entire troubleshooting process.
Suppose your request passes through these layers:
Client
   |
   | 60s
   v
Load Balancer
   |
   | 300s
   v
Ingress Controller
   |
   | 600s
   v
Application
If the load balancer terminates the connection after 60 seconds, increasing the Ingress timeout from 60 to 600 seconds does not solve the problem.
The request never gets the opportunity to use the 600-second timeout.
The shortest relevant timeout in the request path can win.
AWS documentation, for example, states that an Application Load Balancer can return HTTP 504 when it establishes a connection to a target but the target does not respond before the load balancer’s idle timeout. Its default idle timeout is 60 seconds.
That gives us a much better troubleshooting model:
| Layer | What can time out? | What to inspect |
|---|---|---|
| Client | Client-side connection | Browser, curl, application client |
| Load balancer | Idle/target connection | LB configuration and access logs |
| Ingress controller | Upstream connection/read/write | Controller ConfigMap and annotations |
| Service | Backend routing | Service selectors and ports |
| EndpointSlice | Available backend endpoints | EndpointSlice objects |
| Network | Connection path | NetworkPolicy, routing, security groups |
| Pod | Readiness/availability | Pod status and probes |
| Application | Slow processing | Application logs and metrics |
| External API | Upstream dependency | Application dependency logs |
This is why debugging must proceed from the outside toward the backend and then back outward.
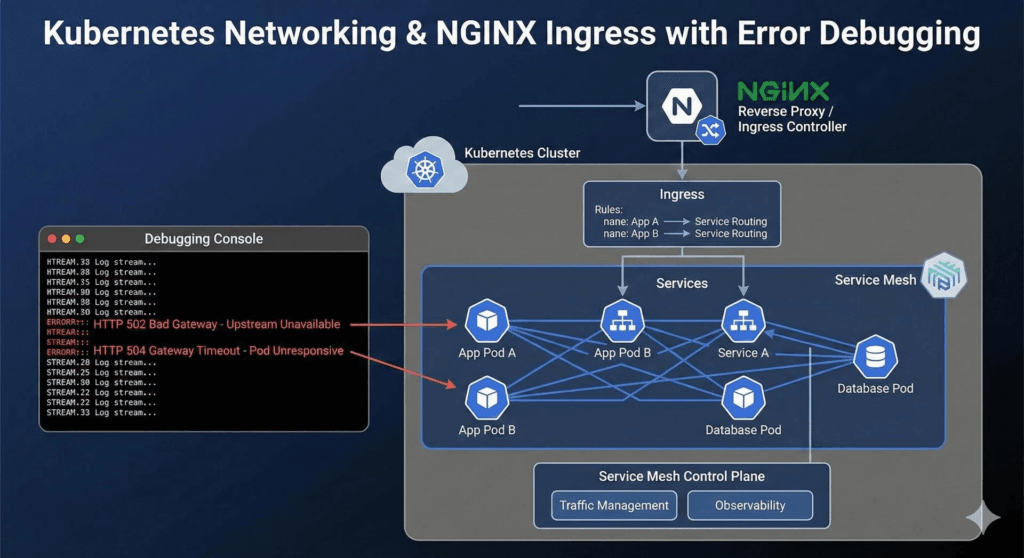
First Check: Which Ingress Controller Are You Actually Using?
Do not assume that “Ingress” means Ingress-NGINX.
Run:
kubectl get ingressclass
Then:
kubectl describe ingressclass <ingress-class-name>
Also inspect the Ingress:
kubectl get ingress <ingress-name> -n <namespace> -o yaml
Look for:
spec:
  ingressClassName: nginx
The modern Kubernetes field is spec.ingressClassName. Kubernetes documents it as the replacement for the older annotation-based approach.
If your cluster uses another controller, such as AWS, GKE, Traefik, HAProxy, or another implementation, do not blindly apply Ingress-NGINX annotations.
For example:
nginx.ingress.kubernetes.io/proxy-read-timeout: "300"
only makes sense when the controller actually understands that annotation.
Important 2026 Warning: Ingress-NGINX Is Retired
If you are troubleshooting an existing Ingress-NGINX deployment in 2026, this matters.
The Kubernetes Ingress-NGINX project was retired in March 2026. The repository was archived on March 24, 2026, and is now read-only. The project documentation states that after retirement, there are no further releases, bug fixes, or security updates, although existing deployments are not automatically broken.
Therefore, if your investigation finds:
Ingress
    |
    v
ingress-nginx
you should distinguish between two questions:
- How do I fix the current 504?
- Should this controller remain part of the architecture?
Those are different questions.
For an existing deployment, you may need to troubleshoot the current controller. For a new architecture, Kubernetes recommends Gateway API rather than continuing to build around the frozen Ingress API.
If you are comparing Ingress controllers with broader gateway solutions, see our guide to open-source API gateways for microservices, which covers tools such as Traefik, Envoy, Kong, APISIX, and NGINX.
Step 1: Confirm the 504 Is Really Coming From the Ingress Layer
Start with an external request.
Use:
curl -vk https://your-domain.example/api/test
For timing information:
curl -vk -o /dev/null \
  -s \
  -w '\nHTTP: %{http_code}\nTotal: %{time_total}s\nConnect: %{time_connect}s\nStartTransfer: %{time_starttransfer}s\n' \
  https://your-domain.example/api/test
The important values are:
- HTTP status
- total time
- connection time
- time to first byte
If the response consistently appears at approximately the same time, that is an important clue.
For example:
HTTP: 504
Total: 60.12s
is much more interesting than simply knowing that the status is 504.
A repeated approximately-60-second failure should immediately make you investigate every component with a 60-second timeout, including the external load balancer.
Do not automatically conclude that NGINX caused it.
Step 2: Check the Ingress Object
Run:
kubectl describe ingress <ingress-name> -n <namespace>
Then:
kubectl get ingress <ingress-name> -n <namespace> -o yaml
Check:
- host
- path
- path type
- IngressClass
- backend Service
- backend port
- annotations
- events
A typical configuration might contain:
metadata:
  annotations:
    nginx.ingress.kubernetes.io/proxy-connect-timeout: "120"
    nginx.ingress.kubernetes.io/proxy-read-timeout: "120"
    nginx.ingress.kubernetes.io/proxy-send-timeout: "120"
Ingress-NGINX documents these as supported timeout annotations. Their values are strings, and the timeout numbers are expressed in seconds.
But before changing them, determine whether they are actually relevant to your failure.
Step 3: Verify the Kubernetes Service
A surprisingly large number of “Ingress problems” are actually Service configuration problems.
Run:
kubectl get svc <service-name> -n <namespace>
Then:
kubectl describe svc <service-name> -n <namespace>
Check:
Selector
Port
TargetPort
Endpoints
A common mistake is:
Ingress → Service port 80
Service → targetPort 8080
Pod → application actually listening on 9090
The Ingress can be perfectly configured while the backend connection fails.
Step 4: Check EndpointSlices
Do not stop at the Service.
Kubernetes automatically maintains EndpointSlice objects describing the endpoints backing a Service.
Run:
kubectl get endpoints <service-name> -n <namespace>
And:
kubectl get endpointslice -n <namespace> \
  -l kubernetes.io/service-name=<service-name>
You want to see actual backend addresses.
If the Service has no usable endpoints, investigate:
kubectl get pods -n <namespace> --show-labels
Compare the Pod labels with the Service selector:
kubectl describe svc <service-name> -n <namespace>
For example:
Service selector:
app=payments
but the Pods might have:
app=payment
That one-character mismatch can prevent the Service from selecting the intended Pods.
Step 5: Check Pod Readiness
A running Pod is not necessarily a ready backend.
Run:
kubectl get pods -n <namespace>
Then:
kubectl describe pod <pod-name> -n <namespace>
Look at:
- Ready condition
- readiness probe
- liveness probe
- restart count
- container state
- recent events
Also check:
kubectl get pods -n <namespace> -o wide
If Pods are repeatedly restarting, becoming unready, or being killed under load, increasing the Ingress timeout is usually treating the symptom rather than the cause.
Step 6: Test the Service Without the Ingress
This is one of the most valuable tests.
If the application works internally but fails through the Ingress, the problem is likely somewhere between:
Ingress → Load Balancer → Controller → Service
or in the controller configuration.
If the application also fails internally, the problem is probably further downstream.
Start a temporary curl Pod:
kubectl run curl-test \
  --rm -it \
  --restart=Never \
  --image=curlimages/curl \
  -- sh
Then, from inside the Pod:
curl -v http://<service-name>.<namespace>.svc.cluster.local:<port>/health
For example:
curl -v http://api.default.svc.cluster.local:8080/health
Test the slow endpoint too:
time curl -v http://api.default.svc.cluster.local:8080/api/slow
This creates an important comparison.
| Test | Result | Likely direction |
|---|---|---|
| External URL | 504 | Continue investigation |
| Internal Service | Works | Investigate Ingress/LB/network |
| Internal Service | 504/timeout | Investigate application/backend |
| Pod IP directly | Works | Investigate Service/Ingress path |
| Pod IP directly | Fails | Investigate application/network |
Step 7: Test the Pod Directly
If you can identify the Pod IP:
kubectl get pod <pod-name> -n <namespace> -o wide
Then from the temporary curl Pod:
curl -v http://<pod-ip>:<port>/health
This is extremely useful because it removes the Service from the test.
You now have three different paths:
External
    ↓
Load Balancer
    ↓
Ingress
    ↓
Service
    ↓
Pod
and:
Curl Pod
    ↓
Service
    ↓
Pod
and:
Curl Pod
    ↓
Pod IP
If the direct Pod request works while the Service request fails, investigate Service/endpoints/networking.
If both internal requests work while the external request fails, move your investigation toward the Ingress controller and load balancer.
Step 8: Read the Ingress Controller Logs
Now inspect the controller.
First identify it:
kubectl get pods -A | grep -i ingress
For an Ingress-NGINX installation:
kubectl get pods \
  -n ingress-nginx
Then:
kubectl logs \
  -n ingress-nginx \
  <controller-pod>
For recent logs:
kubectl logs \
  -n ingress-nginx \
  <controller-pod> \
  --since=10m
Search for:
upstream timed out
connect() failed
no live upstreams
connection refused
504
499
A message such as:
upstream timed out while connecting to upstream
points in a different direction from:
upstream timed out while reading response
The first suggests difficulty establishing the upstream connection.
The second suggests the connection exists, but the backend is not producing data quickly enough.
That distinction matters.
Real Public Case: 504 Even After Timeout Changes
This is where real incident evidence becomes more useful than generic advice.
In Ingress-NGINX issue #10093, the reported environment used:
- Ingress-NGINX v1.4.0
- NGINX 1.19.10
- Helm chart 4.3.0
proxy-send-timeout: 300proxy-read-timeout: 300proxy-connect-timeout: 300- An Ingress annotation with
proxy-read-timeout: "3600"
The reporter used a backend designed to delay its response and requested a 65-second response.
The external request still produced:
HTTP/1.1 504 GATEWAY_TIMEOUT
The controller log showed approximately 59 seconds of upstream timing and a 499 on the NGINX side.
That case is valuable because it disproves the simplistic rule:
“A Kubernetes Ingress 504 always means proxy-read-timeout is too low.”
It does not.
The entire request path must be investigated.
Another Real Case: 3600 Seconds Still Produced a 504
Ingress-NGINX issue #10735 provides another useful example.
The reported environment included:
- Kubernetes v1.28.1
- AWS
- Ingress-NGINX v1.7.0
proxy-connect-timeout: "3600"proxy-read-timeout: "3600"proxy-send-timeout: "3600"
The request still returned:
504 Gateway Time-out
after approximately two minutes.
Again, this is why changing the three NGINX timeout annotations should not be the first and only troubleshooting step.
The important question is:
Which component stopped waiting?
Step 9: Understand the Three Main Ingress-NGINX Timeouts
If you are actually using Ingress-NGINX, these settings are important.
proxy-connect-timeout
This controls the timeout for establishing a connection with the upstream server.
Example:
nginx.ingress.kubernetes.io/proxy-connect-timeout: "30"
The documented default is 5 seconds in the Ingress-NGINX ConfigMap, and the documentation notes that this value generally cannot exceed 75 seconds.
A connection problem looks different from a slow application response.
proxy-read-timeout
This controls the timeout for reading from the proxied server.
Example:
nginx.ingress.kubernetes.io/proxy-read-timeout: "120"
The important detail is that this is not simply a maximum total response duration.
The timeout is measured between successive read operations.
Therefore, this distinction matters:
Backend takes 90 seconds before sending first data
versus:
Backend sends data regularly every 10 seconds
and continues for 10 minutes
They are not equivalent from the proxy’s perspective.
proxy-send-timeout
This controls the timeout for transmitting a request to the upstream server.
Example:
nginx.ingress.kubernetes.io/proxy-send-timeout: "120"
It is also measured between successive write operations rather than being a simple total-request timer.
Default Ingress-NGINX Timeout Values
The documented ConfigMap defaults include:
| Setting | Default |
|---|---|
proxy-connect-timeout | 5 seconds |
proxy-read-timeout | 60 seconds |
proxy-send-timeout | 60 seconds |
This explains why 60-second failures are frequently investigated as possible NGINX timeout problems.
But it does not prove NGINX is responsible.
A cloud load balancer may also have a 60-second idle timeout.
AWS documents a 60-second default for both Classic Load Balancer and Application Load Balancer idle timeout behavior.
Step 10: Verify Helm Values
If Helm manages your controller, do not assume the values in your local values.yaml are the values currently running.
If you are managing Kubernetes as part of a wider cloud environment, our guide to cloud infrastructure deployment best practices covers Helm, Kubernetes, monitoring, and infrastructure-management workflows.
First:
helm list -A
Then:
helm get values <release-name> \
  -n <namespace>
For all configured values:
helm get values <release-name> \
  -n <namespace> \
  --all
Also inspect the deployed manifest:
helm get manifest <release-name> \
  -n <namespace>
This helps answer:
What did Helm actually deploy?
Rather than:
What do I think Helm deployed?
Step 11: Compare Helm Configuration With Live Kubernetes Configuration
Suppose your Helm values contain:
controller:
  config:
    proxy-read-timeout: "300"
    proxy-send-timeout: "300"
    proxy-connect-timeout: "60"
Check the live ConfigMap:
kubectl get configmap \
  -n ingress-nginx
Then:
kubectl get configmap <configmap-name> \
  -n ingress-nginx \
  -o yaml
You are looking for:
data:
  proxy-read-timeout: "300"
  proxy-send-timeout: "300"
  proxy-connect-timeout: "60"
This creates a useful three-way comparison:
Helm values
     ↓
Rendered Kubernetes objects
     ↓
Live controller configuration
If those disagree, you have found an important configuration-management problem.
Step 12: Check the Ingress Annotation Itself
Run:
kubectl get ingress <ingress-name> \
  -n <namespace> \
  -o jsonpath='{.metadata.annotations}'
Or:
kubectl describe ingress <ingress-name> \
  -n <namespace>
Look for:
nginx.ingress.kubernetes.io/proxy-read-timeout
nginx.ingress.kubernetes.io/proxy-send-timeout
nginx.ingress.kubernetes.io/proxy-connect-timeout
Ingress-NGINX documents these annotations as per-Ingress overrides of global timeout settings.
Step 13: Verify the Rendered NGINX Configuration
This is a step many troubleshooting guides skip.
If you have access to the Ingress-NGINX controller Pod, inspect its generated NGINX configuration.
For example:
kubectl exec \
  -n ingress-nginx \
  <controller-pod> \
  -- nginx -T
You can then search for the affected hostname or timeout directives.
For example:
kubectl exec \
  -n ingress-nginx \
  <controller-pod> \
  -- nginx -T | grep -E \
  'proxy_(connect|read|send)_timeout'
The exact output and available commands depend on the controller image/version, so treat this as a diagnostic technique rather than a universal command contract.
The important verification chain is:
Ingress annotation
       ↓
Controller configuration
       ↓
Generated NGINX configuration
       ↓
Actual request behavior
If the first three agree but the request still fails at a predictable time, investigate the next layer.
Step 14: Investigate the Cloud Load Balancer
This is essential when your Ingress controller sits behind a cloud load balancer.
A common architecture is:
Internet
   |
   v
AWS ALB / ELB
   |
   v
Ingress Controller
   |
   v
Service
   |
   v
Pod
The load balancer can produce the 504 before NGINX’s own timeout is reached.
AWS specifically documents HTTP 504 causes including:
- failure to establish a target connection within the connection timeout
- target not responding before the idle timeout
- network ACL problems
- malformed/incomplete response behavior
- Lambda timeout conditions in applicable architectures.
Therefore inspect:
- load-balancer access logs
- target response time
- target health
- idle timeout
- connection timeout
- security groups
- network ACLs
- target registration
- deregistration behavior
Real AWS Example: The Load Balancer Was the Important Layer
Ingress-NGINX issue #6178 documents a real AWS EKS case involving a Classic Load Balancer in front of NGINX.
The reported configuration had:
AWS ELB idle timeout: 55 seconds
NGINX keepalive timeout: 75 seconds
The reported ELB 504 occurred with a timing difference of approximately 55 seconds, matching the ELB idle timeout.
That is an excellent diagnostic clue.
If your failure occurs at:
~55 seconds
and your load balancer has:
55-second idle timeout
you have much stronger evidence than simply seeing “504.”
Step 15: Compare Timeout Thresholds
Create a table for your actual environment.
For example:
| Component | Configured timeout | Observed failure |
|---|---|---|
| Client | ? | ? |
| Cloud LB | 60s | ? |
| Ingress connect | 5s | ? |
| Ingress read | 60s | ? |
| Ingress send | 60s | ? |
| Application server | ? | ? |
| External API | ? | ? |
Then ask:
Which timeout is closest to the observed failure?
For example:
Failure consistently occurs at 59–61 seconds
and:
ALB idle timeout = 60 seconds
Ingress read timeout = 300 seconds
The load balancer deserves immediate attention.
Conversely:
Failure occurs at ~300 seconds
ALB idle timeout = 600 seconds
Ingress read timeout = 300 seconds
makes the Ingress layer much more suspicious.
Step 16: Check Application Logs at the Same Timestamp
This is another powerful test.
Suppose the external request begins at:
12:00:00
and the user receives:
504 at 12:01:00
Search application logs around that exact request.
If the application says:
request started 12:00:00
request completed 12:01:12
while the client received:
504 at 12:01:00
then the application was still working when another layer gave up.
That is a very different problem from:
request never reached application
or:
application returned 500
Correlate timestamps across:
Load balancer logs
        ↓
Ingress logs
        ↓
Application logs
        ↓
External dependency logs
If the Kubernetes application depends on third-party services or internal APIs, review our guide to troubleshooting API integration errors for a broader approach to diagnosing upstream failures, authentication problems, and gateway-related errors.
Step 17: Check NetworkPolicy and Security Rules
If the controller cannot reliably reach the backend, inspect network controls.
Check:
kubectl get networkpolicy -A
Then:
kubectl describe networkpolicy <policy-name> \
  -n <namespace>
Also inspect cloud networking where relevant:
- AWS security groups
- AWS Network ACLs
- Azure NSGs
- GCP firewall rules
- routing tables
- CNI configuration
- service mesh policies
A connection timeout is not necessarily an application timeout.
Step 18: Check Resource Pressure
A slow application may simply be overloaded.
Run:
kubectl top pods -n <namespace>
and:
kubectl top nodes
If metrics-server is available, inspect:
- CPU
- memory
- throttling
- restart frequency
Then inspect the Pod:
kubectl describe pod <pod-name> -n <namespace>
Look for:
OOMKilled
Back-off restarting failed container
Unhealthy
Readiness probe failed
Liveness probe failed
A backend that is CPU-throttled or repeatedly restarting can look like an Ingress timeout problem.
Step 19: Check the Application’s Own Timeout
Do not forget the application server.
Examples include:
- Gunicorn
- uWSGI
- Node.js
- Java application servers
- PHP-FPM
- ASP.NET
- Go HTTP servers
- database connection pools
- reverse proxies inside the Pod
The architecture might actually be:
Client
 ↓
Load Balancer
 ↓
Ingress
 ↓
Service
 ↓
Pod
 ↓
Application Server
 ↓
Database
If the database query takes 120 seconds but the application server kills the request after 60 seconds, changing NGINX to 300 seconds does nothing useful.
The Timeout Chain You Should Build
For slow requests, document the chain explicitly:
Client timeout
      >
Load balancer timeout
      >
Ingress timeout
      >
Application server timeout
      >
Database/API timeout
The exact ordering depends on the architecture.
The key is to avoid having an upstream component terminate a request before the downstream component has a chance to finish.
For example, if your application legitimately requires 180 seconds:
Load balancer: 60s
Ingress: 300s
Application: 180s
the 60-second load-balancer timeout can still terminate the request first.
When Should You Increase proxy-read-timeout?
Increase it only when your evidence shows that the Ingress-NGINX read timeout is actually the limiting layer.
For example:
metadata:
  annotations:
    nginx.ingress.kubernetes.io/proxy-read-timeout: "300"
    nginx.ingress.kubernetes.io/proxy-send-timeout: "300"
If the application genuinely requires long-lived HTTP requests, this may be appropriate.
But do not automatically use:
3600
for everything.
A one-hour timeout can hide:
- slow database queries
- deadlocked applications
- overloaded Pods
- failed external APIs
- resource exhaustion
- broken streaming behavior
Timeouts should reflect an intentional application requirement.
If PostgreSQL is responsible for the delay, use a structured PostgreSQL database performance investigation to check slow queries, missing indexes, locks, connection pressure, and execution plans.
Helm Example for Ingress-NGINX Timeout Configuration
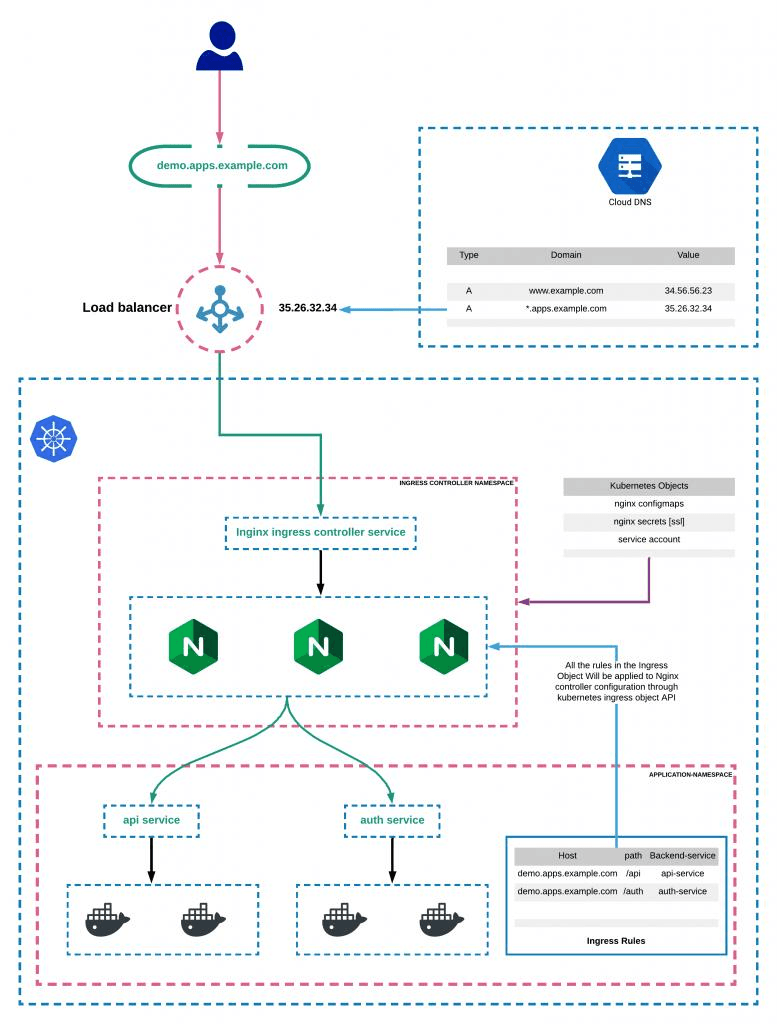
If you are maintaining an existing Ingress-NGINX deployment and Helm manages the controller, the configuration can be represented through Helm values.
For example:
controller:
  config:
    proxy-connect-timeout: "30"
    proxy-read-timeout: "300"
    proxy-send-timeout: "300"
Then upgrade the existing release using the values file:
helm upgrade <release-name> ingress-nginx/ingress-nginx \
  -n ingress-nginx \
  -f values.yaml
Afterward, verify:
helm get values <release-name> \
  -n ingress-nginx \
  --all
Then:
kubectl get configmap \
  -n ingress-nginx
And finally inspect the generated controller configuration.
Do not consider the change complete simply because helm upgrade returned successfully.
Helm Troubleshooting Checklist
Use this sequence:
helm list -A
helm get values <release> -n <namespace> --all
helm get manifest <release> -n <namespace>
kubectl get ingress -A
kubectl get ingressclass
kubectl describe ingress <ingress> -n <namespace>
kubectl get svc <service> -n <namespace>
kubectl get endpoints <service> -n <namespace>
kubectl get endpointslice \
  -n <namespace> \
  -l kubernetes.io/service-name=<service>
kubectl get pods -n <namespace> -o wide
kubectl logs <controller-pod> \
  -n <controller-namespace> \
  --since=15m
Then test the backend from inside the cluster:
kubectl run curl-test \
  --rm -it \
  --restart=Never \
  --image=curlimages/curl \
  -- sh
This sequence is much safer than repeatedly changing timeout annotations.
A Practical 504 Decision Tree
Use this when troubleshooting an incident.
                 504 Gateway Timeout
                         |
                         v
             Does failure occur consistently
                at a specific duration?
                    /             \
                  YES              NO
                   |                |
                   v                v
          Compare all timeout     Check controller
          layers with timing      and backend logs
                   |
                   v
        Does request reach Ingress?
              /            \
            YES             NO
             |               |
             v               v
       Check controller    Check LB/DNS/
       logs + backend      listener/routing
             |
             v
       Does Service have
       healthy endpoints?
          /        \
        YES         NO
         |           |
         v           v
  Test Service      Fix selector/
  from inside       readiness/
  cluster           endpoints
         |
         v
    Does direct Pod
    request work?
       /       \
     YES        NO
      |          |
      v          v
 Check Ingress   Check app,
 and LB          network,
 layers           resources
      |
      v
Compare:
LB timeout
Ingress timeout
App timeout
Dependency timeout
      |
      v
Change only the
limiting layer
      |
      v
Retest and correlate
logs by timestamp
504 vs 502 vs 503
These errors are related but should not be treated as identical.
| Status | General meaning | What to investigate first |
|---|---|---|
| 502 | Bad gateway / invalid upstream interaction | Connection, protocol, upstream response |
| 503 | Service unavailable | Backend availability, endpoints, readiness |
| 504 | Gateway timeout | Which layer stopped waiting? |
The exact behavior depends on the component generating the response.
For example, an AWS Application Load Balancer can generate 504 for several target-side timeout/network conditions.
So the status code alone is insufficient.
Common Kubernetes Ingress 504 Causes
1. Slow application response
The backend simply takes too long.
Test:
time curl -v http://service.namespace.svc.cluster.local:8080/slow
Then compare that time with the external request.
2. Load balancer idle timeout
The cloud load balancer may stop waiting before NGINX or the application does.
Check the LB configuration and access logs.
AWS ALB, for example, has a documented default idle timeout of 60 seconds.
3. No healthy endpoints
Check:
kubectl get endpoints <service> -n <namespace>
and:
kubectl get endpointslice \
  -n <namespace> \
  -l kubernetes.io/service-name=<service>
4. Incorrect Service port
Check:
kubectl describe svc <service> -n <namespace>
Compare:
port
targetPort
with what the application actually listens on.
5. Readiness failure
A Pod can be running while Kubernetes does not consider it ready.
Check:
kubectl describe pod <pod> -n <namespace>
6. NetworkPolicy
Check whether the Ingress controller is permitted to reach the backend.
7. Application resource exhaustion
Check:
kubectl top pods -n <namespace>
and:
kubectl describe pod <pod> -n <namespace>
8. External dependency timeout
The application may be waiting for:
Database
API
Object storage
Message queue
Authentication service
The Ingress only sees a request that has not completed.
9. Controller configuration mismatch
Your Helm values may say one thing while the running controller uses another.
Compare:
helm values
      ↓
rendered manifest
      ↓
ConfigMap
      ↓
Ingress annotations
      ↓
generated proxy configuration
A Real-Data Troubleshooting Example
Suppose you run:
curl -vk https://example.com/api/report
and receive:
HTTP/2 504
after:
60.2 seconds
You check the Ingress:
proxy-read-timeout = 300
You then test internally:
time curl http://report.default.svc.cluster.local:8080/api/report
and get:
Total time: 82 seconds
Now the evidence is much stronger.
You have:
External request: 60 seconds → 504
Ingress read timeout: 300 seconds
Backend response: 82 seconds
That strongly suggests the request is being terminated before the backend finishes, with the load-balancer layer becoming a prime suspect.
If the load balancer has:
Idle timeout = 60 seconds
the numbers line up.
That is a real diagnostic conclusion.
It is much stronger than:
“Increase
proxy-read-timeoutto 600.”
What If the Backend Takes 90 Seconds?
Suppose:
Backend response = 90s
Ingress read timeout = 60s
Load balancer timeout = 120s
Then the Ingress layer is a logical suspect.
If your application intentionally requires 90 seconds, you could raise the relevant Ingress timeout.
But then verify:
Application timeout > expected response time
Ingress timeout > application response time
Load balancer timeout > Ingress/application requirement
Do not change all values blindly.
What If the Backend Takes 10 Minutes?
That is where architecture matters.
If an HTTP request takes:
10 minutes
you should ask whether synchronous HTTP is appropriate.
Instead of:
POST /generate-report
       |
       | waits 10 minutes
       v
200 OK
consider:
POST /generate-report
       |
       v
202 Accepted
       |
       v
Background job
       |
       v
Client polls job status
or:
Request
   |
   v
Queue
   |
   v
Worker
   |
   v
Result storage
Increasing every timeout to one hour may make the immediate 504 disappear while creating a much larger reliability problem.
Long-Running Requests and Streaming Are Different
Do not confuse:
Backend produces no data for 5 minutes
with:
Backend streams data every 10 seconds for 5 minutes
Because proxy-read-timeout is measured between successive reads, the network behavior matters.
For streaming or WebSocket-style workloads, inspect the controller’s protocol-specific configuration as well.
Ingress-NGINX documentation notes that WebSocket support requires appropriate proxy-read-timeout and proxy-send-timeout values, with a documented example of using values above one hour for long-lived WebSocket connections.
gRPC Considerations
If your Ingress-NGINX configuration uses gRPC, timeout settings are also relevant because the documented gRPC timeout values inherit from the corresponding proxy timeout settings.
Check:
proxy-connect-timeout
proxy-read-timeout
proxy-send-timeout
Rather than assuming ordinary HTTP behavior is identical.
Why Logs Matter More Than the 504 Page
A browser may only show:
504 Gateway Time-out
That tells you almost nothing about the root cause.
Controller logs can tell you whether the proxy:
- failed to connect
- connected but waited for data
- retried an upstream
- received an upstream error
- closed a client connection
- returned a generated 504
Load-balancer logs can tell you whether the request reached the target at all.
Application logs can tell you whether the request was processed.
The strongest diagnosis comes from correlating all three.
The Most Useful Evidence to Collect
For a production incident, capture:
1. Exact request URL/path
2. Exact timestamp
3. HTTP status
4. Total response time
5. Ingress controller version
6. Helm chart version
7. Kubernetes version
8. Ingress YAML
9. IngressClass
10. Service YAML
11. EndpointSlice state
12. Pod state
13. Controller logs
14. Application logs
15. Load-balancer logs
16. Load-balancer timeout configuration
17. NetworkPolicy
18. Application timeout configuration
This turns:
“Ingress gives 504.”
into:
“The request reaches the application, the application needs approximately 82 seconds, the Ingress read timeout is 300 seconds, but the external ALB terminates the connection at approximately 60 seconds.”
That is a real diagnosis.
What Not to Do
Do not immediately set every timeout to 3600
A huge timeout can hide the real problem.
Do not assume every 504 comes from NGINX
The load balancer may be returning it.
Do not assume a running Pod is healthy
Check readiness and actual endpoint membership.
Do not test only through the public URL
Test the Service and Pod directly.
Do not trust only your values.yaml
Verify the deployed Helm release and live Kubernetes objects.
Do not ignore timestamps.
A 59-second, 120-second, or 300-second failure can reveal which layer is responsible.
Do not ignore the controller type.
NGINX annotations do not automatically apply to every Kubernetes Ingress implementation.
Helm vs Ingress Annotations: Which Should You Use?
| Configuration method | Scope | Best use |
|---|---|---|
| Helm values | Controller-wide | Consistent global defaults |
| ConfigMap | Controller-wide | Global controller behavior |
| Ingress annotation | Specific Ingress | Different timeout for one application |
| Application configuration | Application | Business/application timeout |
| Load balancer configuration | Edge | External connection behavior |
A good architecture usually uses global defaults plus targeted overrides.
For example:
Global default:
60 seconds

Special long-running API:
300 seconds

Batch processing:
Asynchronous architecture
That is better than making every route wait five minutes.
A Better Helm Verification Pattern
For an existing Helm-managed controller, use:
helm list -A
Find the release.
Then:
helm get values <release> \
  -n <namespace> \
  --all
Then:
helm get manifest <release> \
  -n <namespace>
Now inspect the live resources:
kubectl get deployment \
  -n <namespace>
kubectl get configmap \
  -n <namespace>
kubectl get ingress \
  -A
Finally, test the request again.
The objective is to prove:
Configured
    ↓
Deployed
    ↓
Loaded
    ↓
Used
    ↓
Observed
Kubernetes Ingress vs Gateway API in 2026
There is another important architectural issue for anyone writing new infrastructure today.
Kubernetes now describes Gateway API as the successor to Ingress. The Gateway API provides resources such as:
GatewayClassGatewayHTTPRouteGRPCRoute
It supports more expressive routing models.
The Kubernetes project states that the Ingress API is frozen and recommends Gateway instead.
That does not mean every existing Ingress must immediately be deleted.
It means new infrastructure planning should consider Gateway API and an actively maintained implementation.
For an existing Ingress-NGINX environment, the practical strategy is:
Immediate problem
      ↓
Diagnose and fix 504
      ↓
Document current configuration
      ↓
Assess controller support status
      ↓
Plan Gateway API migration
Complete Kubernetes Ingress 504 Checklist
Use this checklist during an actual incident.
Request
- Exact URL recorded
- Exact timestamp recorded
- HTTP status confirmed
- Response time measured
- Reproduction confirmed
Ingress
- IngressClass identified
- Host checked
- Path checked
- Backend Service checked
- Annotations checked
Service
- Service exists
- Port correct
- TargetPort correct
- Selector correct
- EndpointSlices contain healthy endpoints
Pods
- Pods are Running
- Pods are Ready
- No repeated restarts
- Readiness probes pass
- CPU/memory checked
Network
- NetworkPolicy checked
- Security groups checked
- Network ACLs checked
- Routing checked
Ingress controller
- Controller type confirmed
- Controller version recorded
- Controller logs checked
- Timeout configuration checked
- Rendered configuration verified
Helm
- Release identified
- Chart version recorded
helm get valuescheckedhelm get manifestchecked- Live ConfigMap checked
Load balancer
- LB type identified
- Idle timeout checked
- Connection timeout checked
- Access logs checked
- Target health checked
Application
- Application logs checked
- Application timeout checked
- Database/API dependency checked
- Resource utilization checked
Verification
- Service tested internally
- Pod tested directly
- External request retested
- Logs correlated by timestamp
- Root cause identified before changing additional settings
The Shortest Reliable Debugging Method
If you are under pressure during a production incident, use this sequence.
1. Measure the failure
curl -vk -o /dev/null \
  -s \
  -w '\nHTTP: %{http_code}\nTotal: %{time_total}s\n' \
  https://example.com/api/test
2. Identify the controller
kubectl get ingressclass
3. Inspect the Ingress
kubectl describe ingress <name> -n <namespace>
4. Check the Service
kubectl describe svc <service> -n <namespace>
5. Check endpoints
kubectl get endpoints <service> -n <namespace>
6. Test internally
curl http://<service>.<namespace>.svc.cluster.local:<port>/health
7. Read controller logs
kubectl logs <controller-pod> \
  -n <controller-namespace> \
  --since=10m
8. Check Helm
helm get values <release> \
  -n <namespace> \
  --all
9. Check the load balancer
Compare its timeout with the observed failure time.
10. Change only the layer proven to be responsible
Then retest.
Final Diagnosis Rule
When you see:
Kubernetes Ingress 504 Gateway Timeout
do not immediately ask:
“What annotation fixes 504?”
Ask:
“Which component returned the 504, and what was it waiting for?”
Then trace the request:
Client
  ↓
Load Balancer
  ↓
Ingress Controller
  ↓
Ingress Rule
  ↓
Service
  ↓
EndpointSlice
  ↓
Pod
  ↓
Application
  ↓
Database / External API
Measure the failure time.
Check the logs.
Test the backend directly.
Compare every timeout.
Verify Helm values against the live configuration.
Only then change the timeout that the evidence identifies as the bottleneck.
That approach is much more reliable than repeatedly increasing. proxy-read-timeout.
And in 2026, there is one additional architectural question: if the affected environment still relies on Ingress-NGINX, fixing today’s 504 should also trigger a review of the migration path because the Ingress-NGINX project has been retired and archived.
Key Takeaway
A Kubernetes Ingress 504 Gateway Timeout is a timing problem somewhere in a request chain, not automatically an Ingress configuration problem.
If you can establish:
Where did the request stop?
When did it stop?
What was it waiting for?
Which timeout expired?
Did the request reach the application?
you can usually turn a vague 504 into a specific, testable root cause.