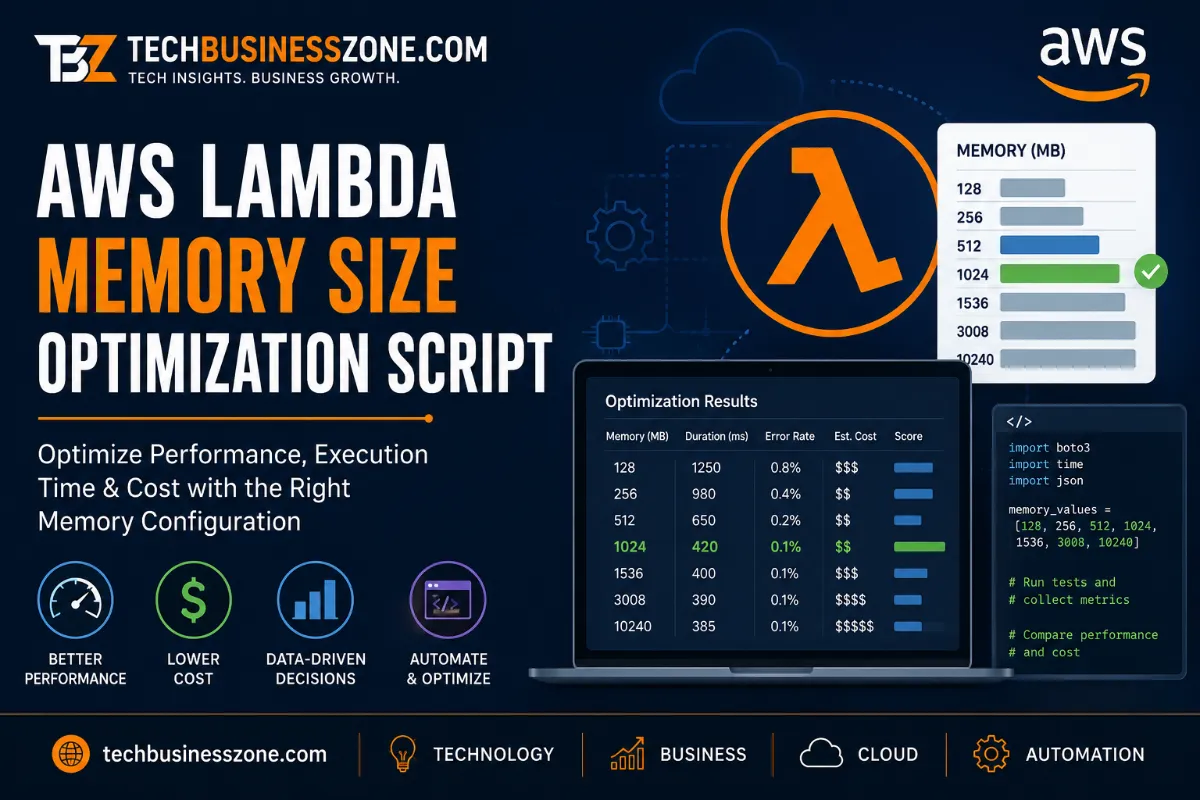
AWS Lambda Memory Size Optimization Script: A Practical Guide to Smarter Performance and Cost Control
A common assumption with AWS Lambda is that memory is simply a setting you increase when a function needs more RAM. That misses an important part of how Lambda works. Memory allocation can also affect the compute resources available to a function, which means the right setting can change both execution time and cost. An AWS Lambda memory size optimization script can make this easier to evaluate.
Instead of guessing whether a function should run with 512 MB, 1 GB, or more, you can test different configurations, collect the results, and compare performance against cost.
The important part is not building a script that always chooses the highest memory setting. The goal is to find a configuration that makes sense for the workload.
Understanding AWS Lambda Memory Allocation
AWS Lambda lets you configure the amount of memory available to each function. The setting is part of the function’s resource configuration, and the appropriate value depends on what the function actually does.
A lightweight function that performs a small calculation may have very different requirements from a function processing large files, transforming images, querying databases, or running compute-heavy code.
That is why there is no single memory setting that works well for every Lambda function.
How Lambda Memory Size Works
Memory is configured per Lambda function, and the value you choose determines how much memory the execution environment has available.
The practical mistake is to look at memory as an isolated resource. When you change the allocation, you can also change the compute capacity available to the function. As a result, increasing memory can sometimes reduce execution time for CPU-intensive workloads.
That creates an optimization problem.
You are not simply asking:
How much memory does this function need?
You are asking:
Which configuration gives this function an acceptable execution time and reliability at a reasonable cost?
Those are different questions.
Why Memory Size Affects Lambda Performance
Consider a function that performs substantial computation. If you increase its memory allocation, the function may have access to additional compute resources and finish faster.
But faster does not automatically mean cheaper.
A higher-memory configuration can cost more per unit of execution. If the function becomes significantly faster, the total cost per invocation may still be favorable. If the performance improvement is small, the additional allocation may not be worth it.
This is why memory optimization should consider duration and cost together.
What an AWS Lambda Memory Size Optimization Script Should Do
A useful optimization script should turn this decision into a measurable comparison.
Rather than changing the function manually and checking one configuration at a time, the script can evaluate selected memory settings, collect results, and present them in a format that makes the trade-offs easier to see.
At a minimum, the process should answer four questions:
- What is the current configuration?
- How does the function perform at different memory sizes?
- Does a higher allocation reduce execution time?
- Which tested configuration provides the most sensible performance-to-cost balance?
The script should also account for failed executions, errors, and timeouts. A configuration that looks inexpensive but regularly fails is not an optimization.
Data the Script Needs Before Optimization
The quality of the result depends heavily on the quality of the measurements.
You need a reasonable baseline before changing anything. Without one, it becomes difficult to determine whether the new configuration actually improved the function.
Lambda Performance Metrics
Execution duration is one of the most useful measurements when comparing memory configurations.
You can also examine:
- Invocation count
- Error count
- Timeout behavior
- Duration variation
- Workload size
- Relevant CloudWatch metrics
The exact metrics worth collecting depend on what the Lambda function does.
For example, a function that processes predictable workloads can be benchmarked differently from one whose execution time varies significantly with input size.
The important point is consistency. If one test processes a small input and another processes a much larger input, comparing their execution times does not tell you much about the memory setting.
Cost and Usage Data
Performance is only half of the decision.
Your comparison should also consider the cost associated with each configuration. Invocation volume matters because even a small difference in cost per execution can become significant when a function runs frequently.
A useful optimization report might therefore show something like:
| Memory Configuration | Execution Duration | Errors/Timeouts | Estimated Cost | Result |
|---|---|---|---|---|
| Current setting | Measure | Measure | Calculate | Baseline |
| Test setting 1 | Measure | Measure | Calculate | Compare |
| Test setting 2 | Measure | Measure | Calculate | Compare |
| Test setting 3 | Measure | Measure | Calculate | Compare |
The actual values should come from your workload and AWS usage data. They should not be filled with generic benchmark numbers.
Workload Characteristics
Before running the tests, document what the function actually does.
Useful information includes:
- Runtime
- Typical input size
- Average invocation frequency
- Whether workloads are predictable
- Whether execution is CPU-heavy
- Whether the function interacts with external services
- Whether execution time changes substantially with input size
Building the AWS Lambda Memory Size Optimization Script
The script does not need to be complicated to be useful. Its job is to automate a controlled comparison.
Collect Function Configuration
Start by retrieving the current Lambda configuration.
The script can record information such as:
- Function name
- Current memory allocation
- Runtime
- Timeout
- Relevant configuration details
Keeping the original configuration is important because it gives you a baseline and makes it easier to revert changes if necessary.
Test Multiple Memory Configurations
Next, define the memory configurations you want to evaluate.
Do not assume that every possible setting needs to be tested. A practical test can focus on a sensible range around the current configuration.
For example, if a function currently runs with a particular allocation, you could test several lower and higher configurations rather than blindly testing every available value.
Each test should use comparable input and execution conditions.
The script should also avoid concluding from a single invocation. Individual executions can vary, especially when external dependencies are involved.
Measure Execution Results
For every configuration, collect the results needed for comparison.
At a minimum, this means recording execution duration and whether the invocation succeeded.
Depending on the workload, you may also want to record:
- Errors
- Timeouts
- Memory-related behavior
- Invocation count
- Relevant CloudWatch measurements
A simple results structure could look like this:
Memory → Test executions → Duration → Errors → Cost estimate → ComparisonThe important thing is that every configuration is evaluated using the same basic methodology.
Compare Cost and Performance
Once the measurements are collected, the script can compare configurations.
Suppose a higher-memory configuration reduces execution time substantially. That may justify the increased allocation.
On the other hand, if increasing memory produces only a small reduction in duration while increasing the estimated cost, there may be little reason to make the change.
The script should therefore avoid a simplistic rule such as:
Highest performance = best configurationA better approach is:
Performance + reliability + cost = optimization decisionThe exact weighting depends on the application.
For a latency-sensitive function, reducing execution time may be more important. For a high-volume background process, controlling running costs may carry more weight.
Example Optimization Workflow
A practical workflow starts with the current production configuration.
First, record the baseline. Then select alternative memory configurations and run representative tests against each one.
After the tests finish, compare the results rather than looking at memory allocation by itself.
For example:
1. Record current configuration
2. Establish baseline performance
3. Select alternative memory sizes
4. Run comparable workloads
5. Collect duration and reliability data
6. Estimate cost for each configuration
7. Compare the results
8. Select a reasonable configuration
9. Deploy the change carefully
10. Monitor production behavior
This approach also makes the optimization repeatable. If the workload changes later, you can run the same process again.
Interpreting the Script’s Results
The output needs some judgment. A script can collect and compare measurements, but it cannot understand every business requirement automatically.
Finding the Best Memory Configuration
The best configuration is not necessarily the one with the shortest execution time.
Imagine one setting produces the fastest execution but costs considerably more, while another setting is slightly slower and substantially cheaper. The second option may be better for a high-volume workload.
Likewise, if a function is part of a user-facing application where latency matters, the faster configuration could be worth the additional cost.
The right answer depends on what the function is expected to achieve.
Identifying Performance Bottlenecks
Memory testing can reveal useful performance patterns, but it should not be treated as a complete performance diagnosis.
If changing memory has little effect, the bottleneck may be somewhere else.
Possible causes include:
- Slow database queries
- External API latency
- Network operations
- Inefficient application code
- Large input or output operations
- Cold-start behavior
- Downstream service limitations
This distinction matters. Increasing memory will not automatically fix a function whose main delay comes from waiting for an external service.
Handling Variable Workloads
Some Lambda functions have highly predictable workloads. Others do not.
A function processing small files may behave very differently from the same function processing large files. Similarly, a function receiving simple requests may have a different resource profile when requests become more complex.
For variable workloads, test data should represent the conditions the function actually encounters.
Otherwise, you may optimize the function for a scenario that rarely happens in production.
Common Mistakes When Optimizing Lambda Memory
One of the biggest mistakes is changing the memory allocation without establishing a baseline. Without baseline measurements, there is no reliable way to judge the change.
Another mistake is optimizing only for duration. A function that runs faster is not necessarily cheaper.
The opposite mistake is just as problematic: choosing the cheapest configuration without considering execution time, errors, or timeouts.
Other common problems include:
- Testing with unrealistic workloads
- Using too few executions to make a meaningful comparison
- Ignoring failed invocations
- Applying one memory setting to unrelated functions
- Forgetting about external service latency
- Treating an old benchmark as permanently valid
Memory optimization should be based on evidence from the workload, not a fixed rule.
Using CloudWatch to Validate the Optimization
Benchmarking before deployment is useful, but production monitoring tells you whether the change actually works under real traffic.
CloudWatch can help you monitor Lambda behavior after the new configuration is deployed.
Pay attention to relevant metrics such as duration, errors, throttles, and invocation behavior. If the workload varies, production measurements can also reveal patterns that a controlled test did not capture.
This creates a useful feedback loop:
Measure → change → monitor → compare → adjust
If production behavior differs significantly from your test results, investigate why before making another configuration change.
When to Automate Lambda Memory Optimization
Automation becomes particularly useful when you have many Lambda functions or when memory settings need to be evaluated repeatedly.
Manually changing configurations, running tests, collecting results, and comparing them becomes tedious as the number of functions increases.
A script can standardize the process and make the results easier to compare.
For a small application with only a few stable functions, manual testing may be enough. There is no need to build a large optimization system if the workload is simple and rarely changes.
Best Practices for Safe Memory Optimization
Start with measured baseline data. You need to know how the current configuration behaves before changing it.
Use representative workloads rather than artificial tests that do not resemble production traffic.
Evaluate performance and cost together. A faster execution can still be a poor choice if its additional cost provides little practical benefit.
Keep changes controlled and reversible. Do not make several unrelated infrastructure changes at the same time if you want to understand what caused a performance change.
Finally, monitor the function after deployment. Lambda workloads can change, and an allocation that works well today may not remain optimal as application behavior evolves.
Frequently Asked Questions
What is AWS Lambda memory size optimization?
It is the process of evaluating different memory configurations for a Lambda function to find a setting that provides an appropriate balance of performance, reliability, and cost.
Does increasing Lambda memory make a function faster?
It can, particularly when additional compute resources help the workload finish sooner. However, the effect depends on the function, so it should be measured rather than assumed.
How can a script find the optimal Lambda memory size?
The script can establish a baseline, test selected memory configurations with comparable workloads, collect performance and reliability measurements, estimate costs, and compare the results.
What metrics should be used for Lambda memory optimization?
Execution duration, invocation behavior, errors, timeouts, and cost-related usage data are useful starting points. The most relevant metrics depend on the function’s workload.
Should every Lambda function use the same memory size?
No. Different functions can have very different resource requirements. Memory should be evaluated according to each function’s workload and performance requirements.
Conclusion
An AWS Lambda memory size optimization script is useful because it replaces guesswork with measurement.
The important part is not simply testing bigger and smaller memory values. You need a baseline, representative workloads, consistent testing, cost analysis, and production monitoring.
A good optimization process might show that a function benefits from more memory. It might also show that increasing memory provides little practical improvement. Either result is useful because you are making decisions based on hard evidence rather than assumptions.